Blog
Building FMAP: an interactive astro-ph paper atlas with embeddings, UMAP, and arXiv metadata
FindMyArxivPaper (FMAP) started as a simple scientific-paper exploration pipeline and grew into a more coherent astrophysics map: a project that fetches astro-ph metadata from arXiv, learns useful text representations from titles and abstracts, evaluates both classification and retrieval, and renders the resulting paper landscape as an interactive browser-based map.
Interactive atlas
The atlas below is the main output of the project. Each point is a paper, coloured by astro-ph category. The positions are not hand-made:
they come from embedding each paper using title + abstract, then projecting those vectors into 2D with UMAP so that local neighborhoods stay visually meaningful.
The embedded website version is intentionally capped to a lighter public snapshot (10k points) so it stays fast and small enough for GitHub Pages. The full project and larger local atlas runs live in the FMAP repository.
View the public interactive snapshot here: /fmap/index.html. For the full project and larger atlas outputs, use the external repository link above.
What the model is doing
FMAP deliberately uses two representations of the same paper dataset, because the project needs two kinds of behavior.
1. Category classification
For supervised category prediction, FMAP uses TF-IDF with unigram and bigram features over the concatenated title and abstract, followed by a LinearSVC. This is fast, interpretable, and surprisingly strong for scientific text, where categories often carry stable terminology.
2. Retrieval and map structure
Separately, FMAP embeds every paper using sentence-transformers/all-MiniLM-L6-v2. Those dense vectors are used for semantic search, nearest-neighbor recommendations, retrieval metrics, and the atlas geometry itself.
Why UMAP instead of PCA?
Earlier versions used PCA for the 2D map. PCA is easy and quick, but it often spreads semantic clusters too evenly and flattens the interesting local geometry. For a paper atlas, that matters: if nearby points do not feel meaningfully related, the map becomes decorative rather than useful.
UMAP gives a much better compromise for this kind of visualization. It preserves local neighborhood structure more faithfully, makes clusters feel more natural, and gives the atlas a denser, more legible shape. In FMAP, the current map uses a moderate neighborhood size with a low minimum distance to keep the local structure compact without turning it into noise.
Main results and figures
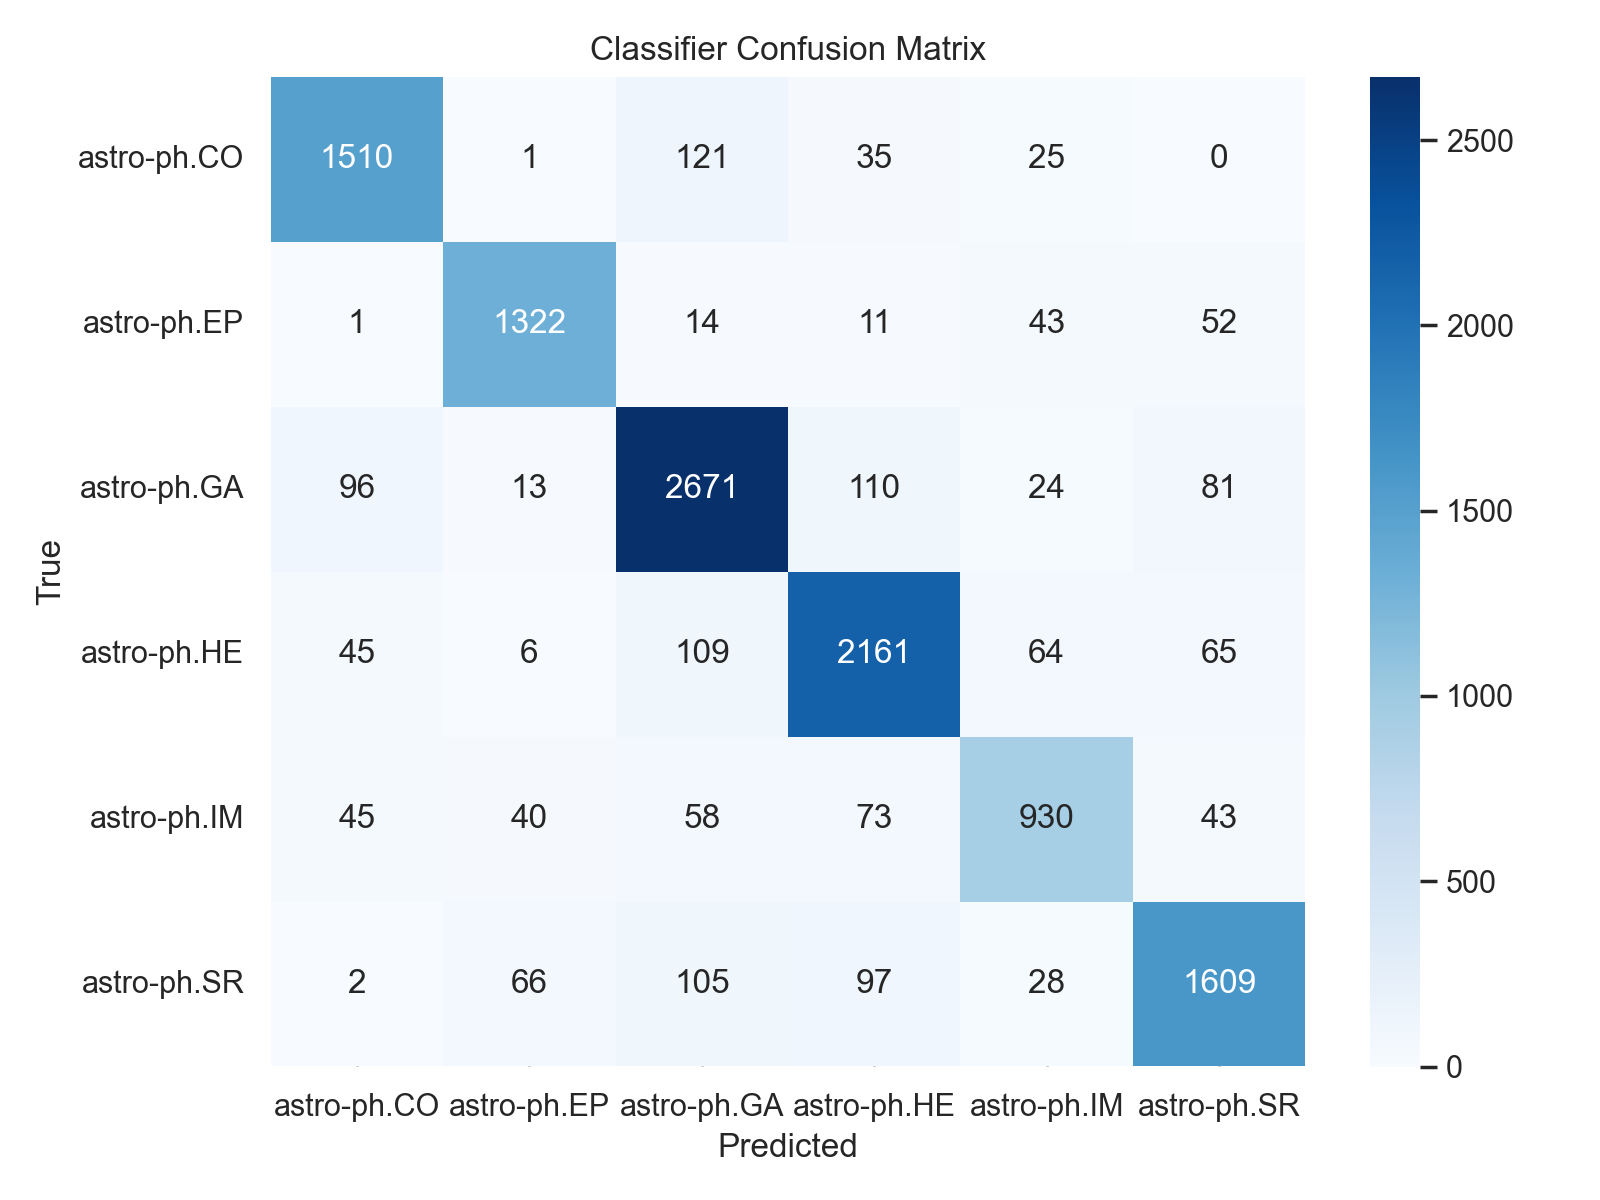
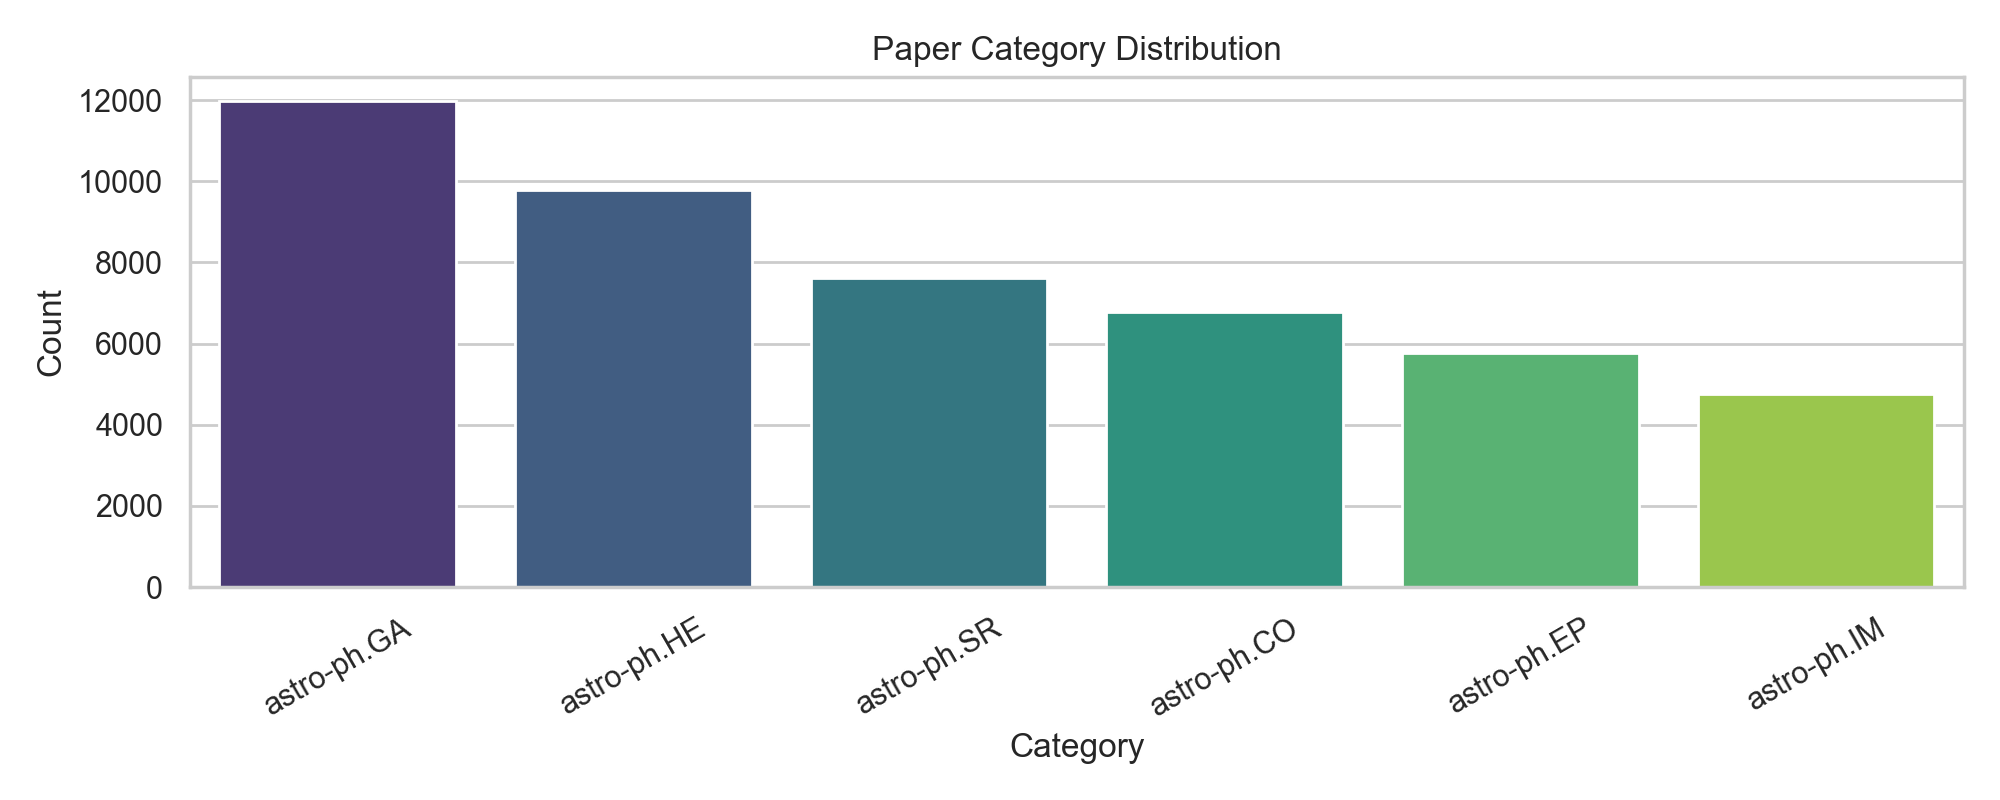
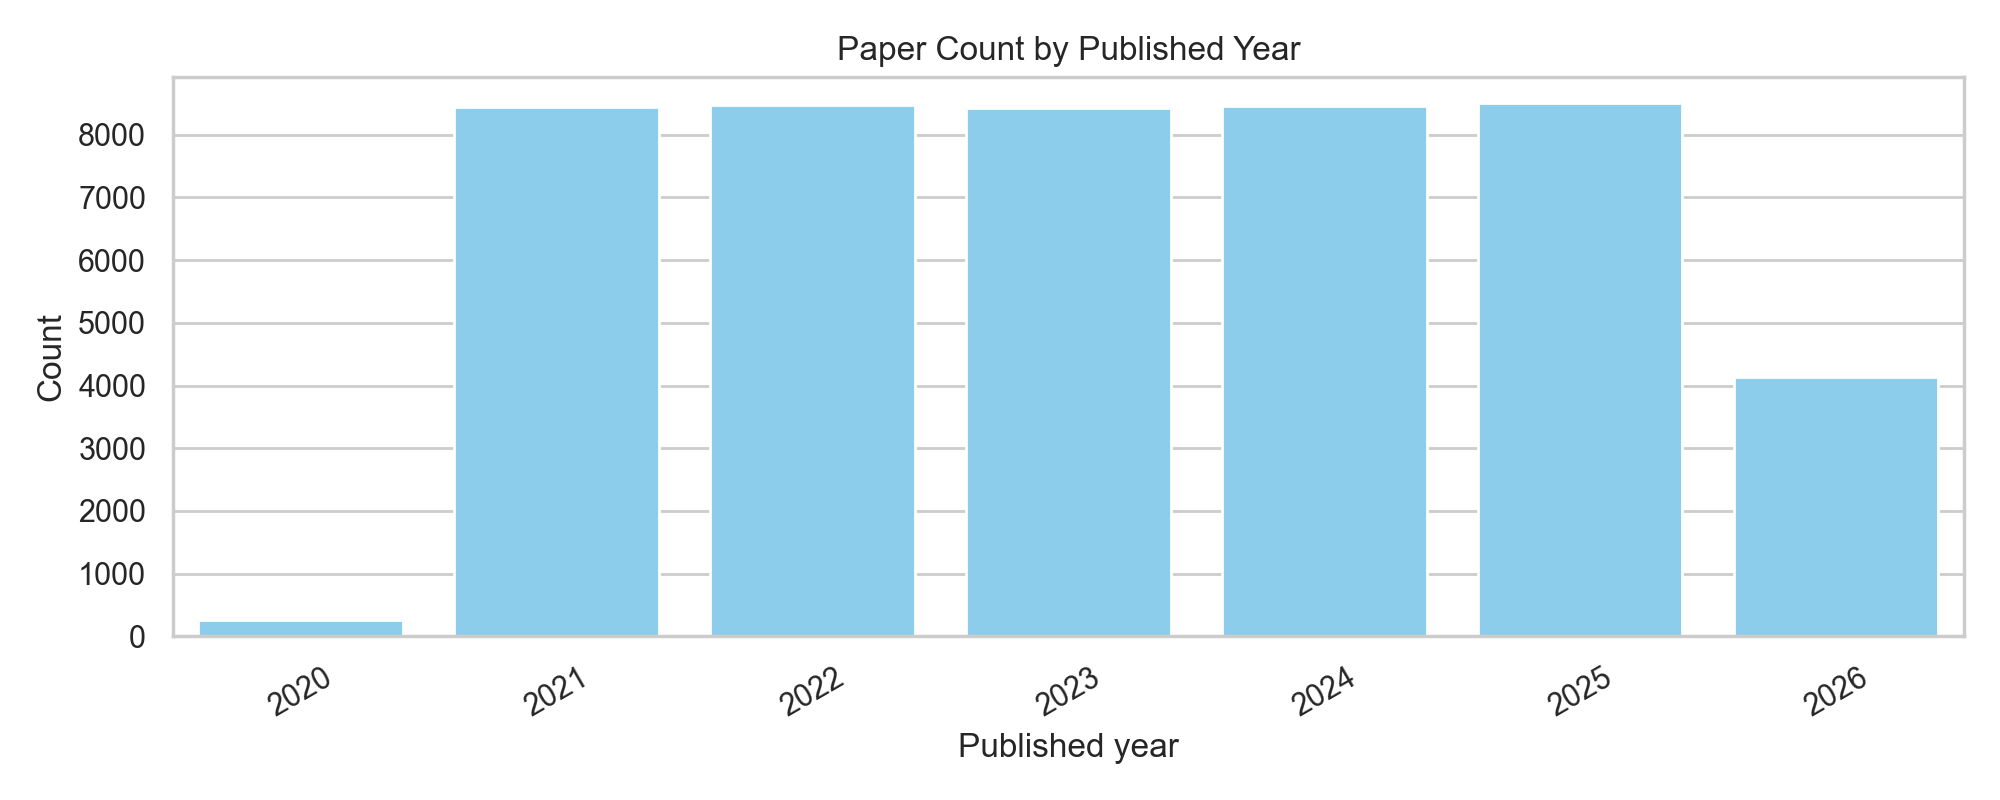
FMAP writes out a small set of useful diagnostics after each run: category balance, year distribution, a 2D embedding view, and a confusion matrix for the supervised classifier. Together they tell you not just whether the model performs reasonably, but also what kind of corpus the atlas actually represents.
How the pipeline works end-to-end
- Query arXiv for astro-ph categories, optionally year-by-year over a historical range.
- Parse metadata and deduplicate records by arXiv URL.
- Build
combined_text = title + abstract. - Split the dataset into training and test partitions.
- Train a TF-IDF + LinearSVC classifier for category prediction.
- Embed every paper using a sentence-transformer.
- Evaluate retrieval using nearest neighbors in embedding space.
- Project embeddings to 2D with UMAP and generate the interactive HTML atlas.
Why I think this project is interesting
FMAP is a good example of the kind of technical work I enjoy: not just training a model in isolation, but building a full loop from data acquisition to representation learning to evaluation to a public-facing interface. The interesting part is the combination: machine learning, scientific text, visualization, and enough systems glue to make the output actually usable.
It is also a nice reminder that project quality is often about structure rather than only model novelty. A simple classifier can be perfectly sensible if the embeddings, atlas, diagnostics, and interaction design make the overall system coherent.